Friday, November 10, 2006

Authorized SAP Training Center in India

For those who are intrested in authorized training center of SAP, Please find the details below.
Bangalore India
Address
SAP India Pvt Ltd
Thapar Niketan7/4
Brunton Road
Bangalore 520025
India
Sapient CollegeLloyd's Centre Point1096A,
1st Floor,
Appasaheb Marathe Marg Prabahdevi,
Mumbai - 400 025

Contact SAP Education India Phone +91-(80)25593554 / 51365669 / 51365670
Fax +91-(80)25095888

Tools-Production Support

Note: There are number of SAP Jobs in india and abroad, keep trying on SAP, don't give up. There are positions open for SAP ABAP in CSC hyderabad.
In the earlier post, we have discussed the problem solving and production support. We have also discussed the various kinds of tickets (Problems). Now in this post we will see how the tickets are tracked? I.e. What tools are used to track the status of the tickets?
You may face this question in the interview, if you say that you have worked for a production support project.
There are many software tools, to manage the problem tickets. Remember this software will not be provided by SAP. It is a different third party software (may be written in any other language like JAVA,).

When ever a problem occurs in the production, end user calls help desk. The help desk will assign a number to the problem. We will call it as problem ticket number. To enter these tickets with description we need a software tool. There are many tools like MANAGE NOW, crm etc.
The following options will be common in any of the tool.
1) You will be provided with user name and password to access the tool
2) You can display the tickets, which are assigned to you, or even you can see the tickets assigned to your colleague by giving his/her user id in the selection input box.
3) You can display all the open tickets, like these there can be many views. You can display the tickets raised in the specified time duration by giving from date and to date.
4) There will be an option to transfer the ticket to other users. Imagine User has raised the ticket, it will be transferred to help desk, then it will go to project manager then he will assign it to the concerned functional consultant. If it is something to do with configuration changes, he himself resolves it. Otherwise if ABAP changes are required, then it may be transferred to tech lead and finally it will be transferred to ABAP consultant from the tech lead. This structure may differ from one company to another.
5) If you open the tool and enter the ticket number, it displays the history of the ticket number. When it was raised, and by whom and the problem description. What is the status? While working on tickets, we should update the status of the ticket in the tool. Some times you need to update the status every 15 minutes if it is severity one problem ticket.

Sunday, November 05, 2006

Test Tools- ABAP Debugger


Test tools in the ABAP workbench are-
1) ABAP debugger
2) Runtime Analysis
3) Performance Trace

In this post, we will discuss about ABAP debugger. This is one of the important topic and you will face questions in interviews.

How do you start ABAP debugger?
There are many ways to start ABAP debugger. They are-
1) From any screen enter /H in the command field to start debugging.
2) From any screen you can start ABAP debugger through MENU System ® Utilities ® Debug ABAP.
3) From the initial screen of the ABAP Editor- Program ® Execute ® Debugging (or the Debugging pushbutton).
4) From the Object Navigator (SE80) Select a program and choose Test/Execute from the Development Object menu. The Choose Execution Type dialog box appears. Choose Debugging
5) You can set break point in the program directly and you can enter into debugging mode in middle of program execution

What is the use of debugging?
Imagine you have written a report program, you have fixed all the syntax errors in the program and activated it. After executing the program you find that the output produced is not matching the expected output. Then you have to examine your code. You can execute the program in debugging mode and can watch the values of fields and tables used in the program.

What options (Display modes) is there in debugging tool?
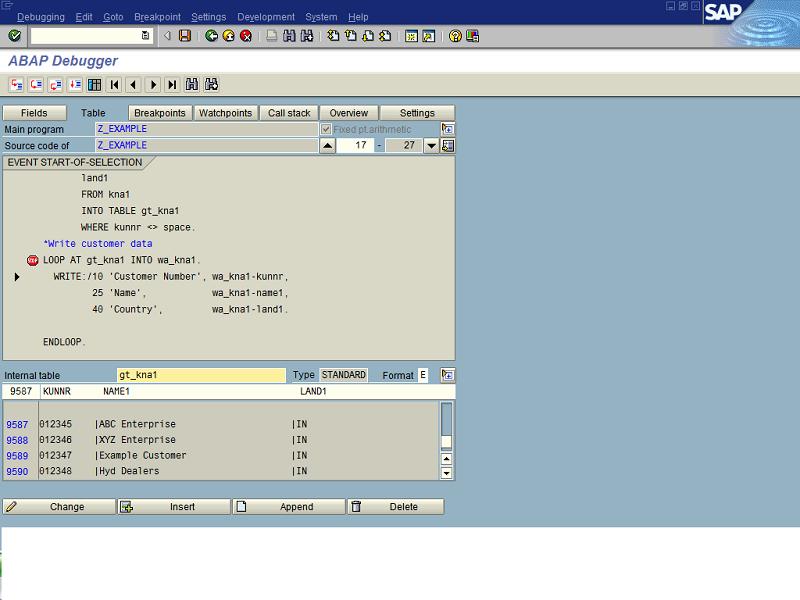
To make you acquainted with debugging tool, here I am pasting the screen shot.
You can see the following display modes in the screen-
1) Fields
2) Table
3) Breakpoints
4) Watchpoints
5) Calla
6) Overview
7) Settings

In this post, we will discuss the basic and important display modes 1, 2, 3, and 4. In future we will see the advanced modes Calls and Settings.

1) Fields
This is the default display mode in the debugging. You can see the contents of fields (Data Variables). The maximum number of fields you can see is eight. We can also see three most important fields in this mode. Those system fields are always displayed at the bottom of the screen. The fields are-
SY-SUBRC, SY-TABIX & SY-DBCNT.
We can also edit the contents of the fields; to save the contents you should click the Change (Pencil Icon).

2) Table
Displays the contents of an internal table. This mode allows us to display and edit the contents of the internal table.

3) Breakpoints
Maximum number of Breakpoints displayed is 30. To set break point in the program, choose the line and then click on STOP (RED ICON). The line will be highlighted with yellow color.
You can also set the break point dynamically when you are in debugging mode. To set a break point in debugging mode, double click on the line.

4) Watchpoints
If you want to interrupt a program when the contents of a field or structure change, use a watchpoint. You can set up to five watchpoints, including watchpoints for strings.
A watch point can be either local or global.
Enter the name of the field for which you want to create watch point. If you want to stop when ever the value of the field changes, then the creation of watchpoint is over.
But if you want to compare the value of the field with another field or value, you should choose the relational operator and you should provide the name of the field or value in the box provided.
I will explain you the advantage of the watchpoint in real time.
You are debugging a program which is of 5000 lines. You can not execute the program line by line. It takes longer time. You want to observe the contents of few fields. You can create watchpoints for those fields. So that whenever your field’s value changes the program will come to stop automatically displaying message ‘Watchpoint reached’.
Another example is , if you want to stop the loop execution at certain line. Imagine your internal table is having 10000 records. You want to observe the execution of the logic at record 5000.
Loop at itab.
*Processing logic
Endloop.
You can create a watchpoint with any one of the itab’s field and you can stop at 5000 record. You need not execute the loop record by record.
Stepping through source code:


There are four different ways in which you can step through the source code of a program you want to analyze:
1) Single Step
This option is used to step through the program statement by statement. This allows you to branch into subroutines and function modules, and to execute these routines step by step as well. Once a subroutine or function module has been processed, control returns to the statement following the CALL FUNCTION or PERFORM statement.
2) Execute
This option is used to process a program line by line. All of the statements on the current line are processed in a single step. If you are positioned on a line that calls a subroutine and you choose Execute, the Debugger processes the whole subroutine and then moves on to the line following the subroutine call. This allows you to jump through the statements within the subroutine.
3) Return
The Debugger returns from a routine to the point at which control returns to the main program. Use this option to return from a subroutine, function module, or called program to the calling program.


4) Continue
This option is used to process the program up to the next dynamic or static breakpoint or up to the cursor position. If there are no more breakpoints in the program and no cursor has been set, the system exits debugging mode and executes the rest of the program normally.

Production Support - Ticket Resolving

Note: For Previous posts refer the Archive link in this web page.
What is SAP Production Support - Ticket Resolving
1. How the tickets in production support are resolved?
2. Give some examples with solutions?
3. What are the types of ticket and its importance?
To answer these types of questions, read below.
Before going further, we need to know about SLA. What is SLA? SLA stands for Service Level Agreement. Imagine there is a software company Tech Sols limited which doing production support for a client is named Best Soaps Inc. Best Soaps Inc and Tech Sols will come to an agreement where they define expectations.
SLA defines the service agreement between Best Soaps Inc and Tech Sols. For example the document defines the time frame to solve the different types of problem tickets.
What happens if the Tech sols could not solve a problem occurred in the Production as per the agreement? Best soaps Inc will impose penalty on Tech sols. All these terms and conditions will be defined during SLA preparation
The severity of the Problem Tickets depends on the SLA. It can be like:
1. Critical. 2. Urgent. 3. High. 4. Medium 5. Low
The response times and resolution times again are defined in the SLA based on the clients requirement and the charges.
This is probably from the viewpoint of Criticality of the problem faced by the client as defined by SAP.
1) First Level Ticketing:
Not severe problem. Routine errors. Mostly handled by Service desk arrangement of the company (if have one).
Eg: a) Say Credit limit block in working on certain documents? b) Pricing Condition Record not found even though conditions are maintained? c) Unable to print a delivery document or Packing list?
PS: In the 4th phase of ASAP Implementation Methodology (i.e. Final Preparations for GO-LIVE) SAP has clearly specified that a Service desk needs to be arranged for any sort of Implementation for better handling of Production errors.
Service desk lies with in the client.
2) Second Level Ticketing:
Some sort of serious problems. Those could not be solved by Service Desk. Should be referred to the Service Company (or may be company as prescribed in SLA).
Eg: a) Credit Exposure (especially open values) doesn't update perfectly to KNKK Table. b) Inter company Billing is taking a wrong value of the Bill. c) Need a new order type to handle reservation process d) new product has been added to our selling range. Need to include this into SAP. (Material Masters, Division attachments, Stock Handling etc.)
3) Third Level Ticketing:
Problems could not be solved by both of the above, are referred to Online Service Support (OSS) of SAP Itself. SAP tries to solve the Problem, sometimes by providing the perfect OSS Notes, fits to the error and rarely SAP logs into our Servers (via remote log-on)for post mortem the problem. (The Medical check-up client, connections, Login id and Passwords stuff are to be provided to SAP whenever they need or at the time of opening OSS Message.)
There are lots of OSS Notes on each issue, SAP Top Notes and Notes explaining about the process of raising a OSS Message.
Sometimes SAP Charges to the client / Service Company depending on the Agreement made at the time of buying License from SAP.
Eg: 1) Business Transition for the Currency 'EUR' is not possible. Check OSS Note - This comes at the time of making Billing. 2) Transaction MMPI- Periods cannot be opened – See OSS Note.
There are many other examples on the issue.
4) Fourth Level Ticketing:
Where rarely, problems reach this level.
Those problem needs may be re-engineering of the business process due to change in the Business strategy. Up gradation to new Version. More or less this leads to extinction of the SAP Implementation.
Note: In real time you will be provided with OSS notes Log in ID and password. With the help of that user ID and password you can login to the URL service.sap.com and search for OSS notes.

Blogger template 'YellowFlower' by Ourblogtemplates.com 2008